North Kawhia
Catchment monitoring by the Kawhia Harbour Care commenced in May 2022.
It covers eight sites sampled on a quarterly basis. There are five monitoring sites in North Kawhia and four sites in South Kawhia. Waikato Regional Council (WRC) has one monitoring site in the lower Oparau River (North Kawhia), which is monitored monthly.
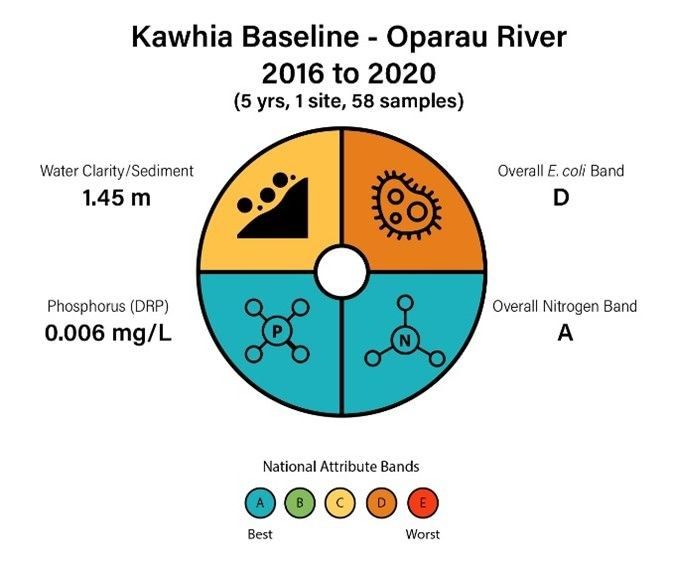
A water quality baseline was calculated from the time the catchment group was formed using five years of monitoring data (Jan 2016 – Dec 2020). The data was collected monthly at the WRC site.
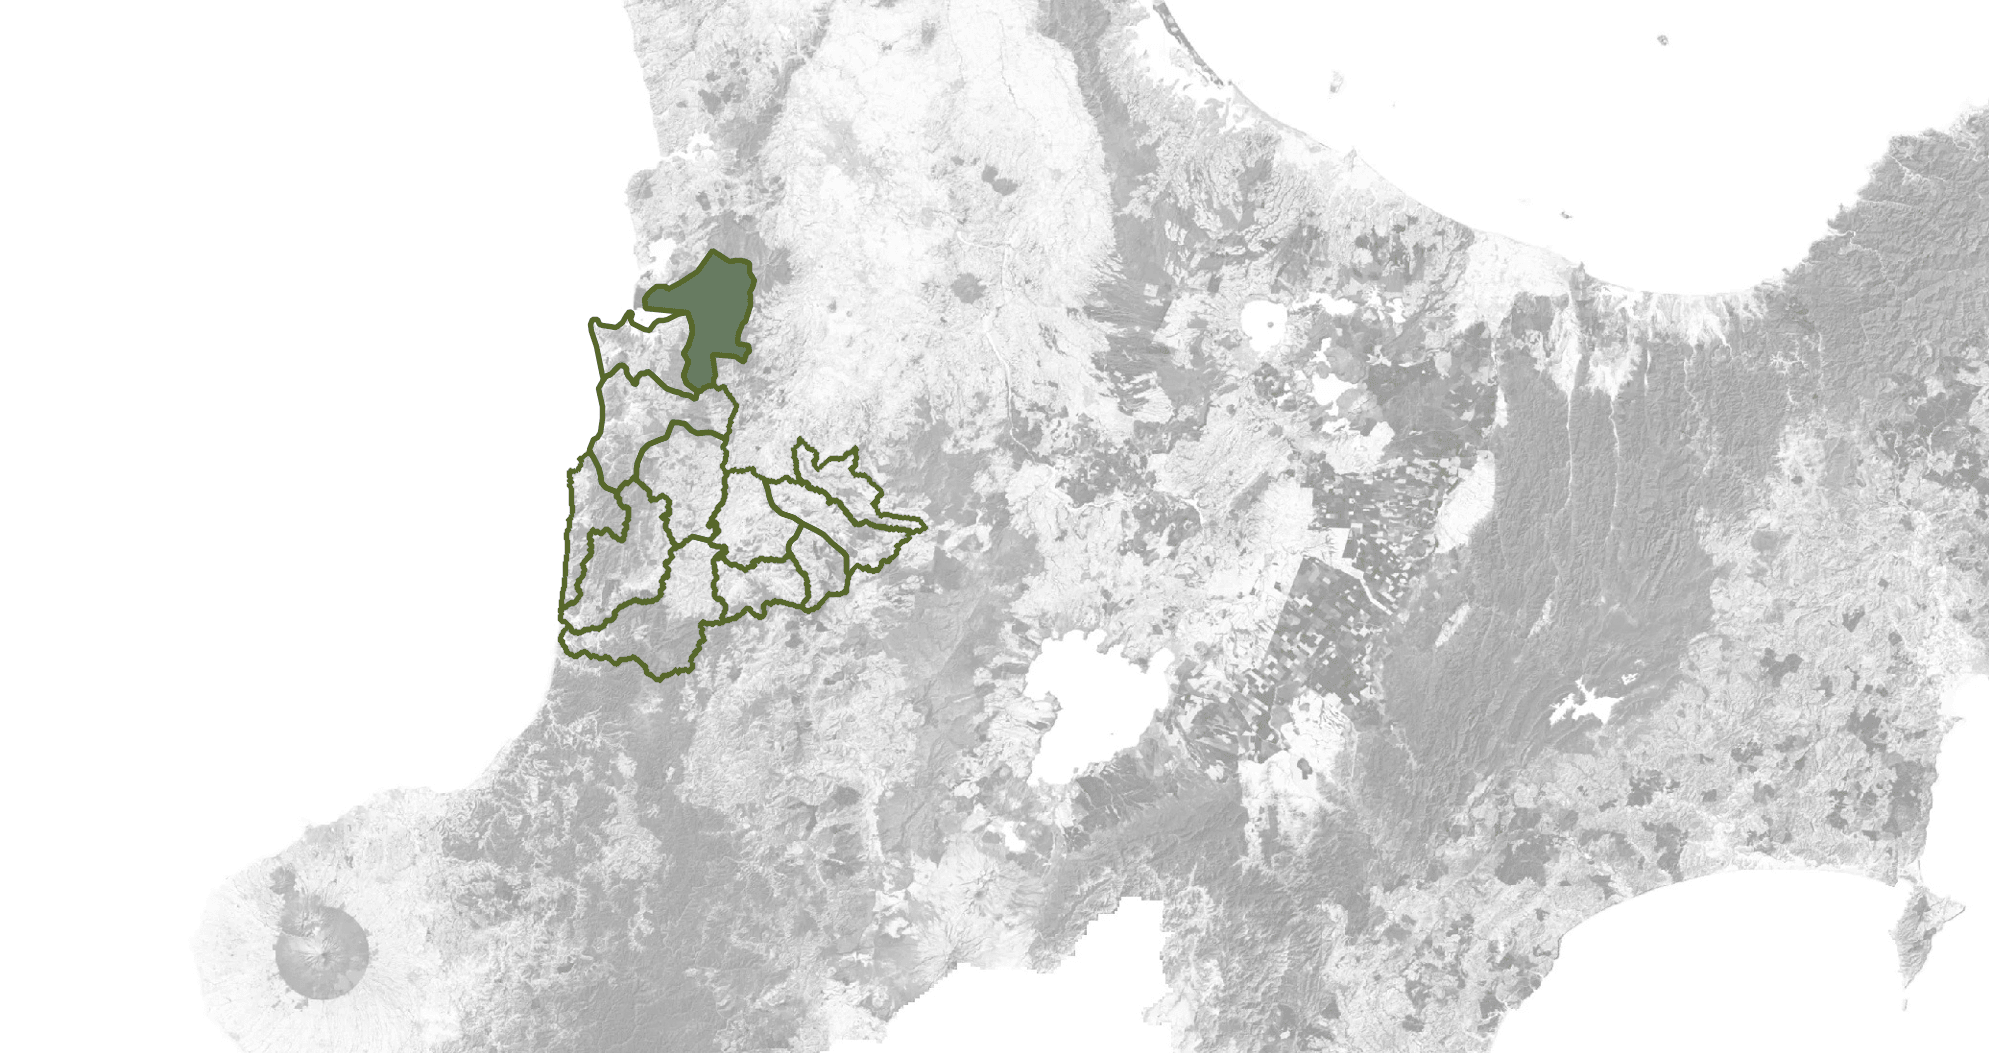
The location of the five monitoring sites in North Kawhia are shown on the right.
North Kawhia Catchment – Key Resources Being Lost from the Land
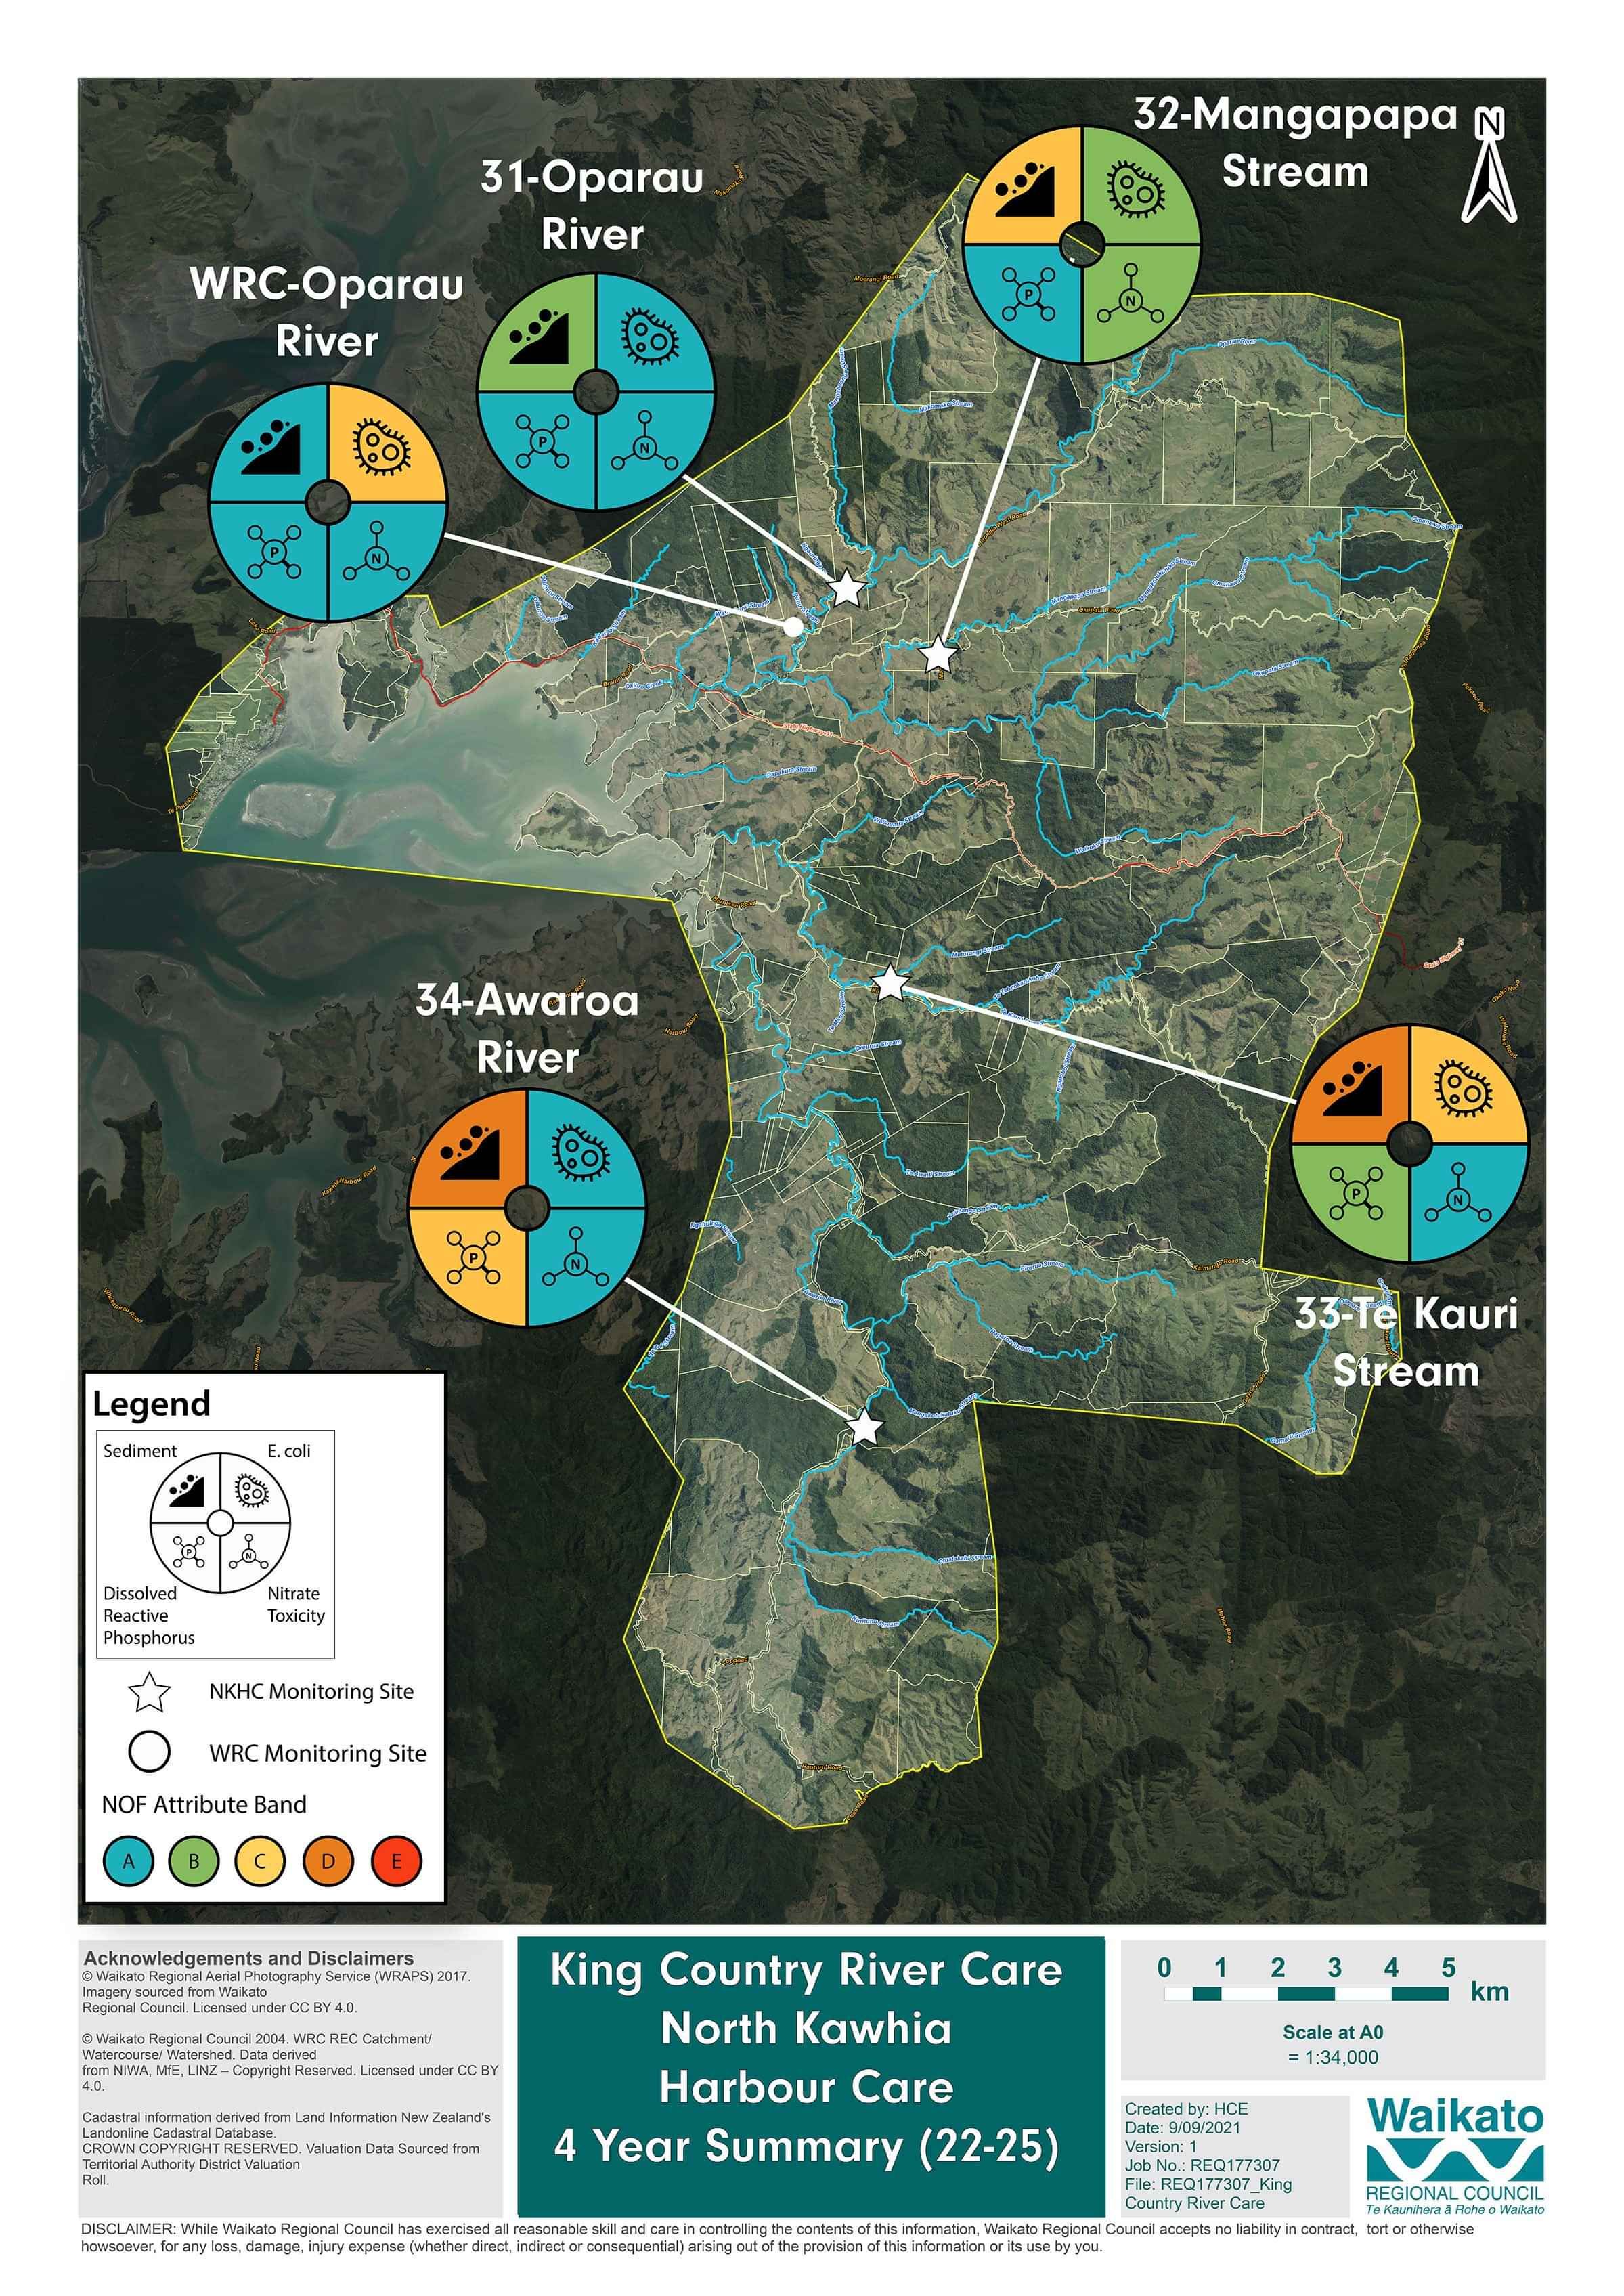
Monitoring Results show that the key resources being lost from the North Kawhia catchment are Sediment and E. coli. E. coli represents a loss of organic matter and nutrients, and it is largely associated with animal manure in rural catchments. Sediment loss represents the loss of soil and nutrients.
The below water quality dials summarise the results collected from the five sites in the North Kawhia catchment. The dial on the left shows the baseline for the catchment, calculated from five years of regional council monitoring at Oparau River, representing 58 individual samples. The dial on the right combines all data collected in the North Kawhia catchment in 2025, representing 27 samples. Arrows indicate either an increase or decrease in values compared to the sub-catchment baseline levels. An increase in water clarity is positive for river health while an increase in all other indicators may impair river health.
In 2025, All categories met national water quality limits. Compared to the baseline – Water clarity and Nitrogen are worse while Dissolved Reactive Phosphorus (DRP) and E. coli measurements are better.
Full Report Available to Download
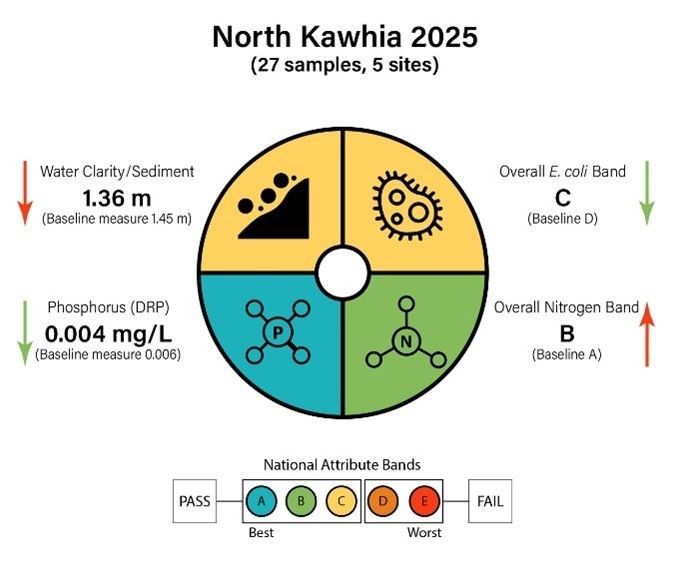
Water quality dials for the North Kawhia catchment.
The bottom dial shows the sub-catchment baseline (2016-2020)
The top dial combines results collected in the 2025 monitoring period.
2025 Quarterly Summaries
February 2025
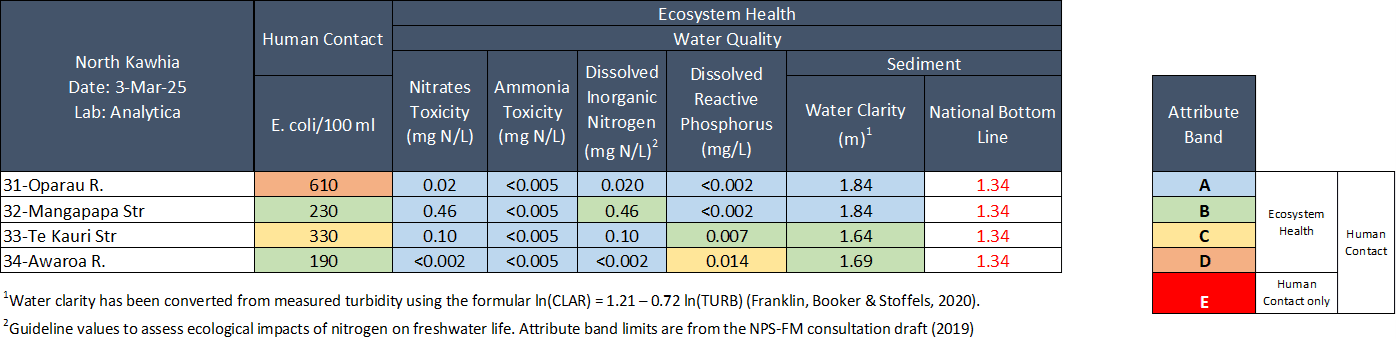
Water quality was Excellent in Mangapapa stream (Site 32), Good in Te Kauri stream (Site 33) and Awaroa river (Site 34) and Fair in Oparau river (Site 31).
E. coli concentrations were elevated in Oparau River and slightly elevated in Te Kauri stream. Concentrations in Oparau River exceeded recommended health guidelines for swimming (540 cells per 100 mL). Awaroa river had the lowest E. coli concentrations (190 cells per 100 mL).
Nitrogen:
Nitrate concentrations were low across all sites, falling well below ecological toxicity levels (2.4 mg/L). Oparau river had the lowest nitrate concentrations (0.02 mg/L) and Mangapapa stream had the highest concentrations (0.46 mg/L).
Ammonia concentrations were very low across all sites (≤ 0.005 mg/L).
Dissolved inorganic nitrogen (DIN) was also low across all sites (≤ 0.46 mg/L), falling below the ecological impact threshold (0.5 mg/L).Phosphorus:
Dissolved reactive phosphorus (DRP) concentrations were low in three sites (≤ 0.007 mg/L). Awaroa river had slightly elevated DRP concentrations (0.014 mg/L).Suspended sediment/Water Clarity:
Water clarity was good across all sites (range = 1.64 to 1.84 m), relative to the national bottom line (1.34 m). Oparau river and Mangapapa stream had the highest water clarity. Te Kauri stream had the lowest water clarity.
The results in the table below have been graded according to the National Policy Statement for Freshwater Management (NPS-FM, 2020).
Sample Collection Day: 3rd March 2025
2025 Quarterly Summaries
May 2025
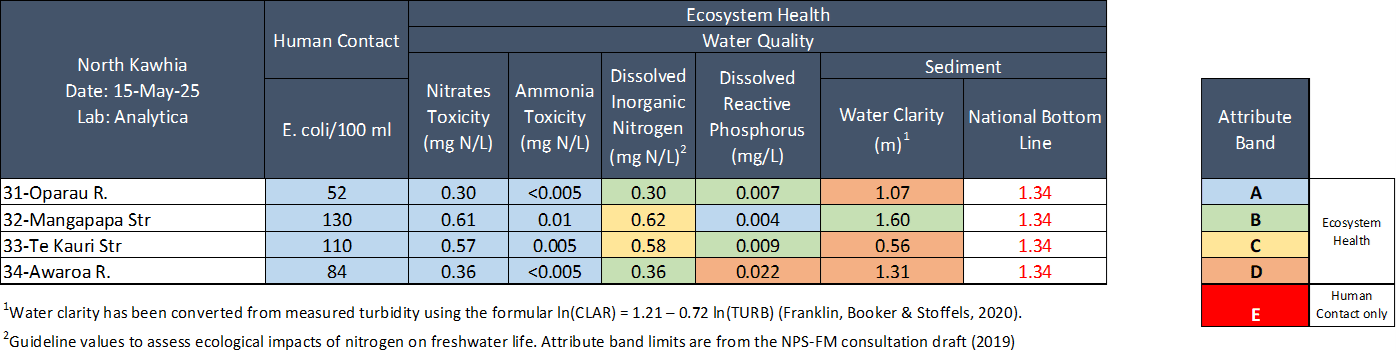
Water quality was Good in the Mangapapa stream (Site 32), and Fair in Te Kauri stream (Site 33), Awaroa river (Site 34) and Oparau river (Site 31).
E. coli concentrations were very low across all sites (≤ 130 cells per 100 mL). All sites fell within health guidelines for swimming (540 cells per 100 mL), and Oparau river and Awaroa river met guidelines for livestock drinking water (< 100 cells per 100 mL).
Nitrogen:
Nitrate concentrations were low in Oparau river and Awaroa river (≤ 0.36 mg/L), and moderate in Te Kauri stream (0.57 mg/L) and Mangapapa stream (0.61 mg/L). All sites fell well below ecological toxicity levels (2.4 mg/L). Oparau river had the lowest nitrate concentration (0.30 mg/L) and Mangapapa stream had the highest concentration (0.61 mg/L).
Ammonia concentrations were low across all sites (< 0.01 mg/L).
Dissolved inorganic nitrogen (DIN) was low in Oparau river and Awaroa river (≤ 0.36 mg/L) and slightly elevated in Mangapapa stream and Te Kauri stream, exceeding the ecological impact threshold (0.5 mg/L).Phosphorus:
Dissolved reactive phosphorus (DRP) concentrations were low in three sites (≤ 0.009 mg/L) and elevated in Awaroa river (0.022 mg/L).Suspended sediment/Water Clarity:
Water clarity was Good in Mangapapa stream (1.60 m) and Poor in the other three sites (≤ 1.31 m), relative to the national bottom line (1.34 m).
The results in the table below have been graded according to the National Policy Statement for Freshwater Management (NPS-FM, 2020).
Collection date: 15th May 2024
2025 Quarterly Summaries
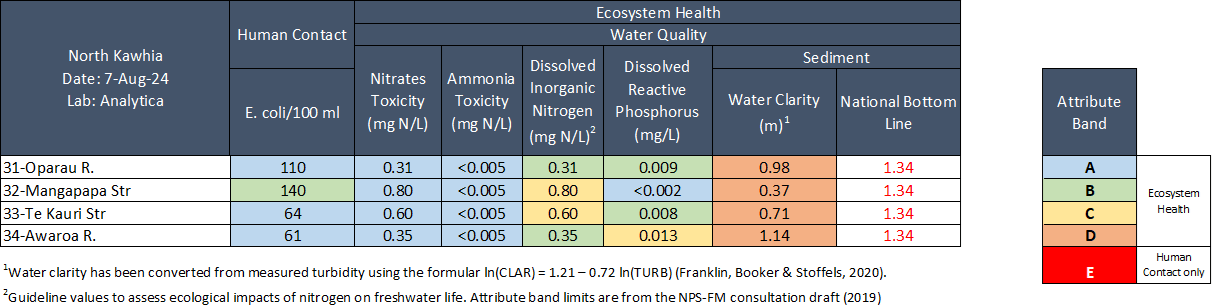
August 2025
Water quality was Fair across all four sites –Mangapapa stream (Site 32), Te Kauri stream (Site 33), Awaroa river (Site 34) and Oparau river (Site 31).
E. coli concentrations were very low across all sites (≤ 140 cells per 100 mL), falling well within health guidelines for swimming (540 cells per 100 mL). Te Kauri stream and Awaroa river also met guidelines for livestock drinking water (< 100 cells per 100 mL) [1].
Nitrogen:
Nitrate concentrations were low in Oparau river and Awaroa river (≤ 0.35 mg/L), and moderate in Te Kauri stream (0.60 mg/L) and Mangapapa stream (0.80 mg/L). All sites fell well below ecological toxicity levels (2.4 mg/L). Oparau river had the lowest nitrate concentration (0.31 mg/L) and Mangapapa stream had the highest concentration (0.80 mg/L).
Ammonia concentrations were low across all sites (< 0.005 mg/L).
Dissolved inorganic nitrogen (DIN) was low in Oparau river and Awaroa river (≤ 0.35 mg/L), but was slightly elevated in Mangapapa stream and Te Kauri stream, exceeding the ecological impact threshold (0.5 mg/L).Phosphorus:
Dissolved reactive phosphorus (DRP) was low in three sites (≤ 0.009 mg/L) and slightly elevated in Awaroa river (0.013 mg/L).Suspended sediment/Water Clarity was Poor across all sites (≤ 1.14 m), relative to the national bottom line (1.34 m).
The results in the table below have been graded according to the National Policy Statement for Freshwater Management (NPS-FM, 2020).
[1] Drinking water for livestock should contain < 100 cfu/100 mL (median value) of E. coli. Livestock Drinking Water Guidelines (2023), Australian & New Zealand Guidelines for Fresh & Marine Water Quality.
Sample Collection Day: 7th August 2024
2025 Quarterly Summaries
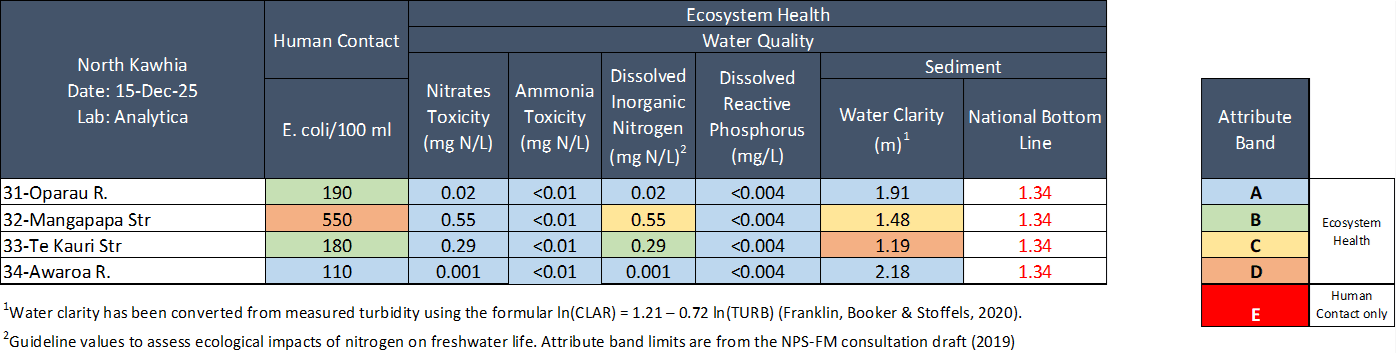
November 2025
Water quality was Excellent at Oparau River (Site 31) and Awaroa River (Site 34), and Fair in Mangapapa stream (Site 32) and Te Kauri stream (Site 33).
E. coli concentrations were very low across three sites (≤ 190 cells per 100 mL), falling well within health guidelines for swimming (540 cells per 100 mL) and were elevated in Mangapapa stream (550 cells per 100 mL). No sites fell within guidelines for livestock drinking water (< 100 cells per 100 mL) [1].
Nitrogen:
Nitrate concentrations were low in three out of four sites (≤ 0.29 mg/L), and moderate in Mangapapa stream (0.55 mg/L). All sites fell well below ecological toxicity levels (2.4 mg/L). Oparau river had the lowest nitrate concentration (0.02 mg/L) and Mangapapa stream had the highest concentration (0.55 mg/L).
Ammonia concentrations were low across all sites (< 0.01 mg/L).
Dissolved inorganic nitrogen (DIN) was low in three out of four sites (≤ 0.29 mg/L), but was slightly elevated in Mangapapa stream, exceeding the ecological impact threshold (0.5 mg/L).Phosphorus: Dissolved reactive phosphorus (DRP) was low in all sites (< 0.004 mg/L).
Suspended sediment/Water Clarity was Excellent in Oparau river and Awaroa river (1.91-2.18 m), Fair in Mangapapa stream (1.48 m) and Poor in Te Kauri stream (1.19 m), relative to the national bottom line (1.34 m).
The results in the table below have been graded according to the National Policy Statement for Freshwater Management (NPS-FM, 2020).
[1] Drinking water for livestock should contain < 100 cfu/100 mL (median value) of E. coli. Livestock Drinking Water Guidelines (2023), Australian & New Zealand Guidelines for Fresh & Marine Water Quality.
Sample Collection Day: 15th December 2025
North Kawhia
Data & Downloads
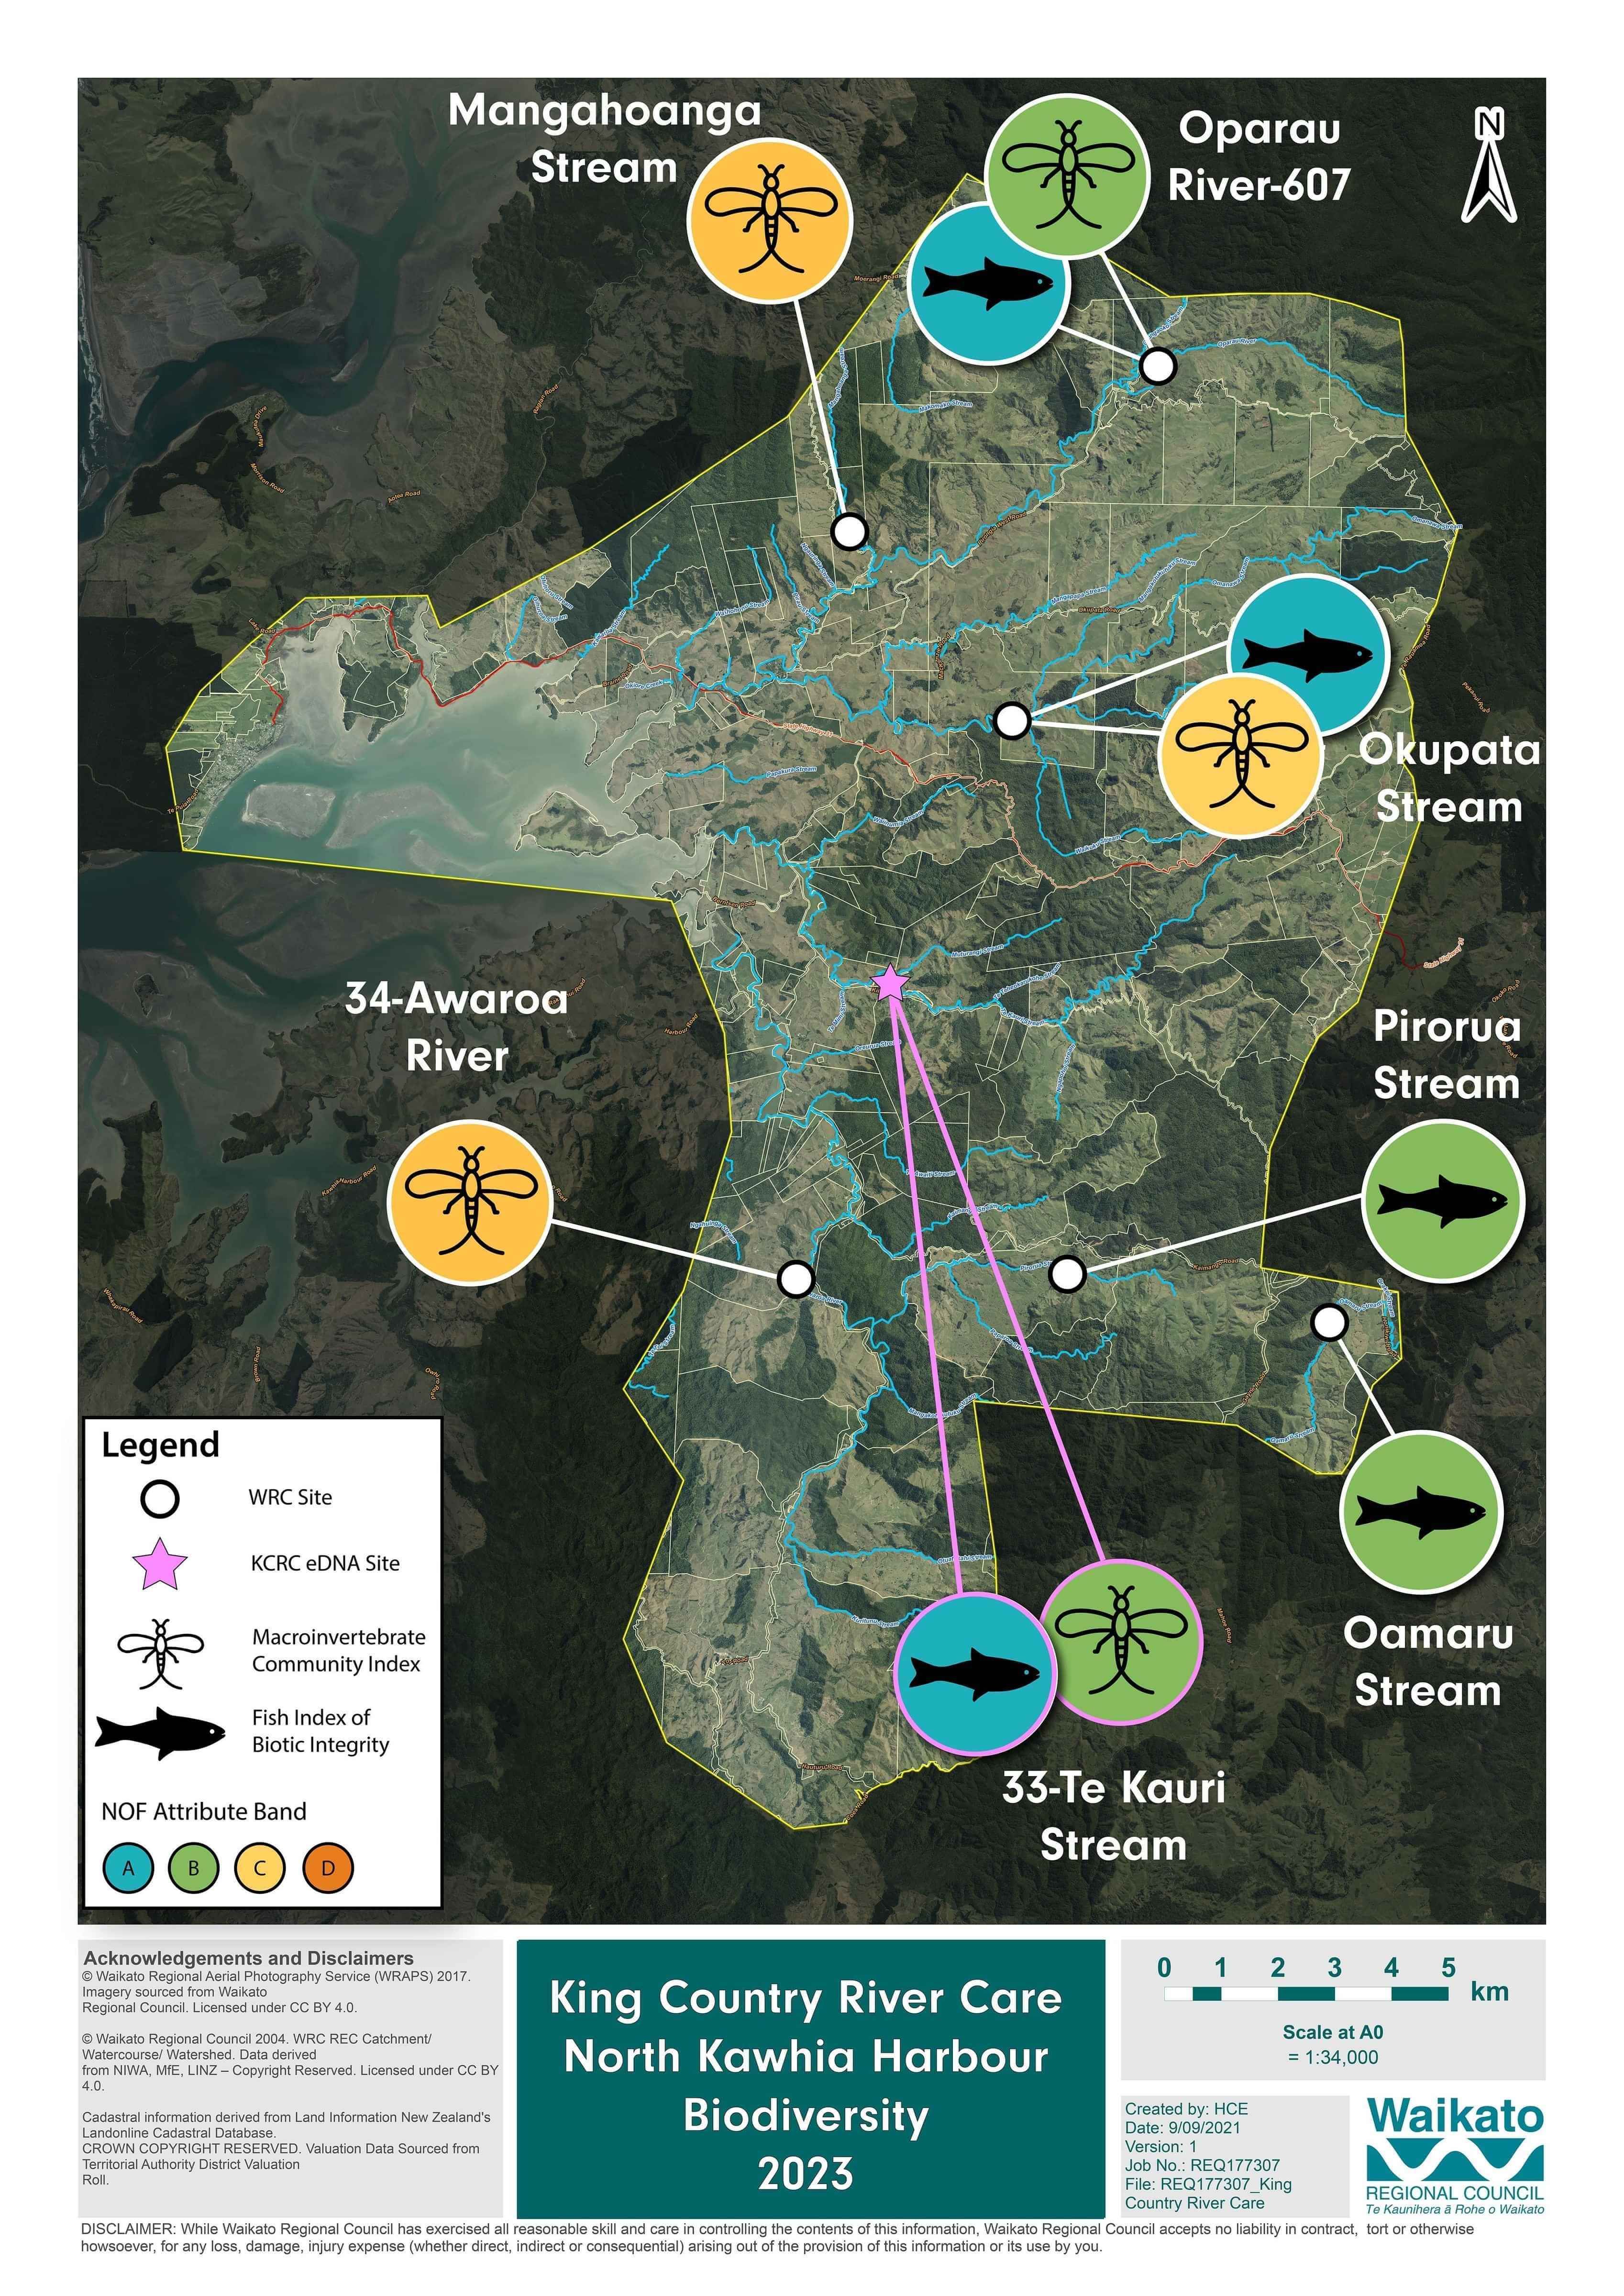
Aquatic Biodiversity Summary
Biodiversity monitoring includes eDNA, collected by KCRC, and traditional biodiversity monitoring techniques (netting of freshwater invertebrates and netting and electrofishing of freshwater fish), by Waikato Regional Council (WRC). eDNA sampling has been done by KCRC, in autumn and winter in 2021, 2022 and 2023. WRC monitors most sites every 1 to 2 years, between November and March. If more than one results is available for any single monitoring location the results for that site are averaged across years.
Both North and South Kāwhia have significant freshwater biodiversity value, however, some sites are showing early signs of ecological stress.
Just under halve of freshwater invertebrate MCI scores are good.
The number of insect species detected from eDNA (an indicator for ecological health) were low in Te Kauri stream (North Kāwhia), 17 species and moderate in Puaroa stream (South Kāwhia), 39 species.
Fish communities were diverse across north and south Kāwhia.
Three whitebait species were detected, Giant kōkopu, Banded kōkopu and inanga.
Six species of threatened fish present, including lamprey, Īnanga, Giant kōkopu, Longfin eel, Redfin bully and Torrentfish.
Only 1 species of introduced fish was detected, brown trout.